
Bitcoin Structural Integrity: 2026-02-20
Rolling exponents always return home.

Bitcoin is trading 44.38% below its implied price, in accordance with the power law. While Bitcoin continues to trade at a deep discount, this has had no significant impact on the long-term model fit.
Daily Drift Diagnostics (2026-02-20)
Exponent: 5.6452 (-0.085%)
R²: 0.943 (+0.0106%)
In our last post we showed how a log-log regression over the full price data generates a daily exponent that oscillates around our reference value over time. We showed this in both zoomed-in and zoomed-out views. Additionally, we showed how it does this while r² (the model fit itself) increases.
To investigate those oscillations, we can use the same log-log regression but this time over different sliding time windows. Our team chose 2-year and 4-year windows as the basis for our long-term comparison.
Here’s how those rolling exponents look when graphed with our full exponent.
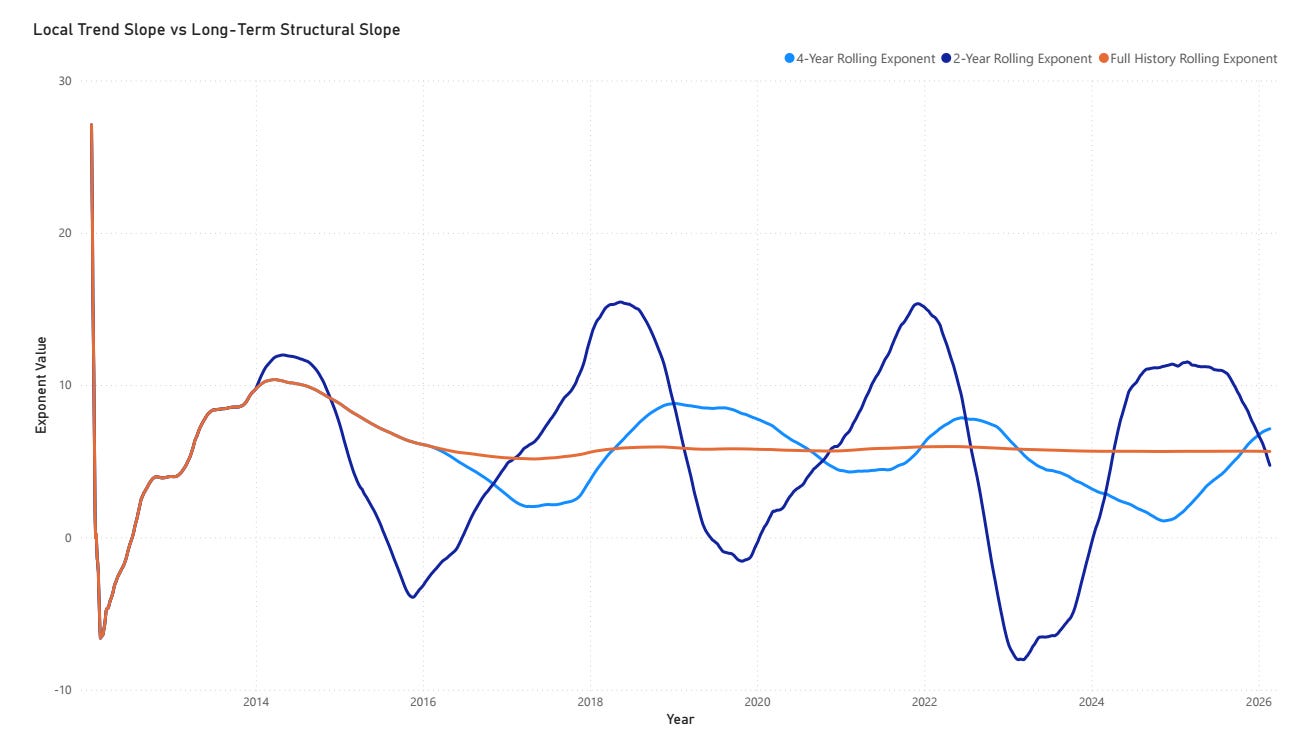
The rolling exponents oscillate around the full history exponent. The 2-year line moves more aggressively, and the 4-year line is smoother. This makes sense, especially when you consider the full history exponent becomes flat, sits on top of 5.65, and visually anchors the overall structure. In this sense, rolling exponents measure whether recent behavior is accelerating or decelerating relative to that structural drift.
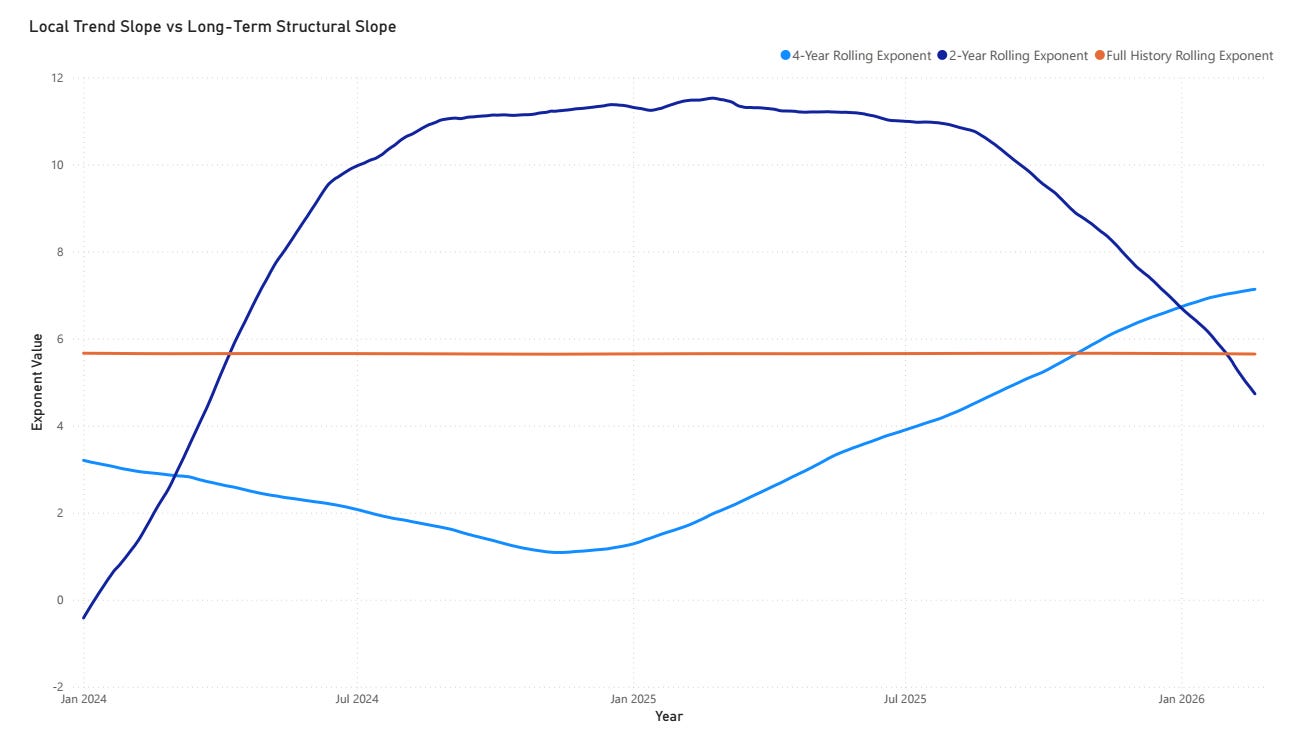
Zooming into just the past two years reveals a visual top, where the exponent remained elevated between July 2024 and August 2025. This wasn’t the previous cycle top, which came in October, but it did represent an area where Bitcoin price was becoming overheated relative to the implied price. The 2-year exponent peaked and rolled over prior to the October price high, reflecting local flattening of log-log slope before the cycle top.
How can we use this?
We’re primarily interested in the crossing events. If we expect oscillation around 5.65 to continue, then what might these events suggest about time and price? There are two events we’re watching closely in the coming months:
If the current trajectory continues, the four-year rolling exponent is likely to top and cross below 5.65 in the coming months. That would signal that recent behavior has been flatter than the long-term pattern.
The two-year rolling exponent will bottom. That would signal that recent behavior has stopped dislocating to the downside, and historically, such bottoms in the short-window slope have preceded reversion toward the structural exponent.
We track these as instrumentation, not to replace the structural view. Historically, when both rolling exponents fall below 5.65, it is a regime worth watching closely. We believe the data indicates we are approaching that regime.