
Bitcoin Structural Integrity: 2026-04-06
Weekly powerlaw snapshot (p20) and macro digest.

The Bitcoin is trading 44.44% below its implied price, in accordance with the power law. The long-run fit of Bitcoin’s structural integrity suggests resilience, contrasting with local spot fluctuations that may mislead short-term perceptions.
Daily Drift Diagnostics (2026-04-06)
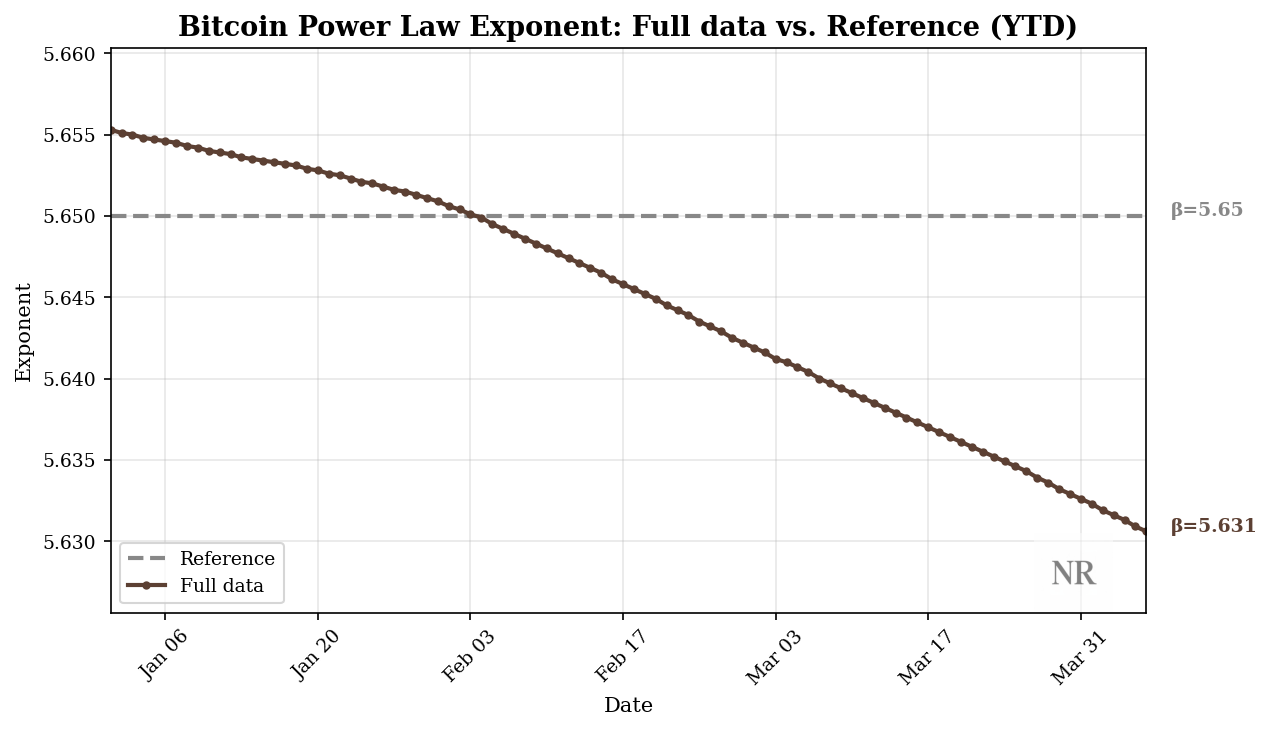
Exponent: 5.6306 (-1.9400%)
R²: 0.9433 (+0.0400%)
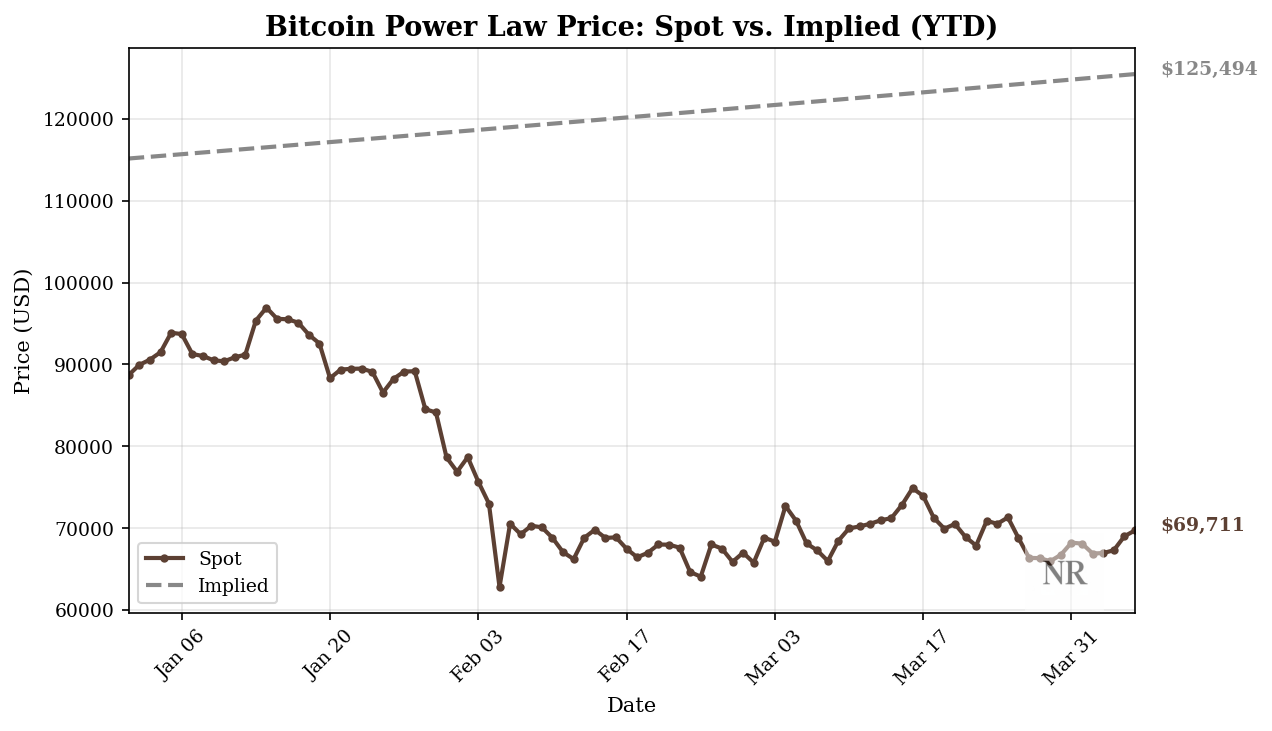
April 6, 2026 @ $69,720 (p20) Bitcoin is meaningfully discounted relative to its implied path. Followers of our research will note that we’ve been in this regime since early February, when we warned “we’ve been here before and we don’t expect to leave quickly.”
This deviation is local, and we believe the long-term observed Power Law will return price back just as it has done before. Oscillations around this long-term attractor are a feature, not a bug or failure mode. This is how the system breathes: deviations expand and compress around a stable scaling relationship.
Weekly Macro (03/30 → 04/05)
Last week, equity market weakness and rising oil prices have heightened volatility across various asset classes. As the week progressed, the narrative shifted towards expectations of potential rate cuts following the appointment of Kevin Warsh to the Federal Reserve, suggesting a complex interplay between inflationary pressures from energy prices and the outlook for monetary policy. This evolving backdrop has introduced uncertainty into risk asset positioning, with market participants grappling with the implications of both geopolitical tensions and changing monetary policy.
As for Bitcoin, activity remained subdued early in the week, characterized by low on-chain metrics and a rangebound price. However, mid-week developments indicated a modest uptick in institutional interest, particularly through Bitcoin-backed financing options. This shift highlights a potential for increased capital flows, contingent upon regulatory clarity, which remains a critical factor for sustained institutional engagement.
The week concluded with a notable divergence in sentiment, as Bitcoin is viewed by some as a defensive asset amidst broader market skepticism, underscoring the need for careful risk management in a volatile environment.
Exponent and fit are our quick integrity checks. The exponent is the slope on the log-log chart and tells us how strongly price scales with time.
Today’s full-data exponent is 5.6306, which is right in the neighborhood of the long-run attractor we track. That matters because the implied price is not a “target”, it’s simply the value implied by that slope at today’s time coordinate.
Today’s full-data R² = 0.9433. R² is the “how much of the variance is explained by the model” sanity check. High fit and stable exponent is what we mean by intact structure: volatility can be violent, but the long-horizon relationship continues to describe the data.
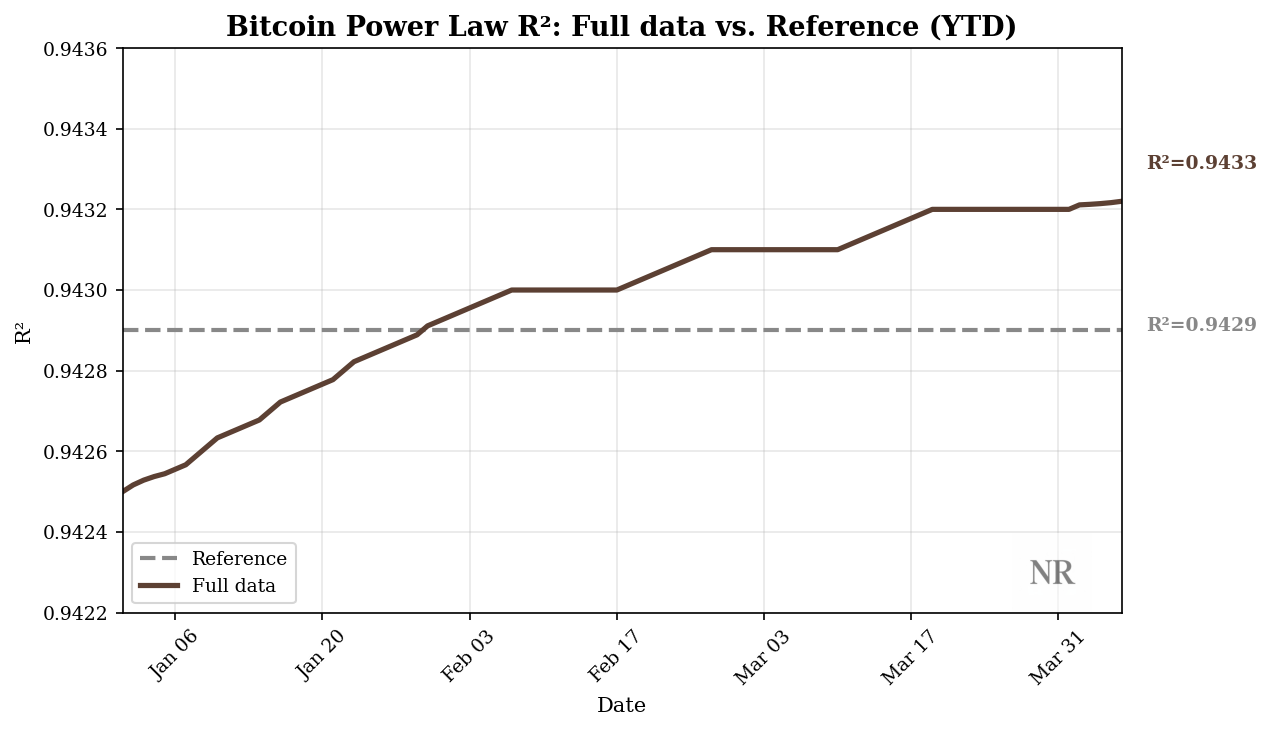
The current exponent and R² values indicate that the power law remains intact. They suggest that the long-term relationship is still present, even as spot trades are undervalued.
Prioritize the underlying structure. Everything else is just background noise.
Would you consider subscribing? It helps keep you updated with the latest observability, receive the latest experiments, research, and support more of our work. Thank you!