
Bitcoin Structural Integrity: 2026-02-18
Zoom in. Enhance. Zoom out.

Bitcoin is trading 43.86% below its implied price, in accordance with the power law. This makes Bitcoin cheaper than yesterday, with no significant drift from long-term model fit.
Daily Drift Diagnostics (2026-02-18)
Exponent: 5.6455 (-0.080%)
R²: 0.943 (+0.0106%)
Let’s zoom in, over the last ~2 years of data, and explore how the exponent and r² have evolved. Included in blue are their reference values.
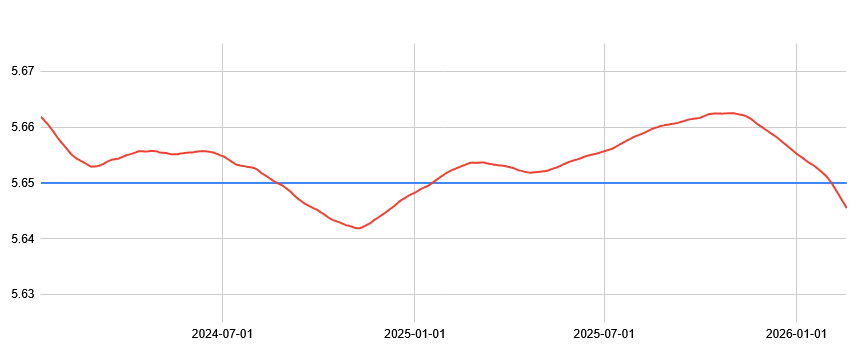
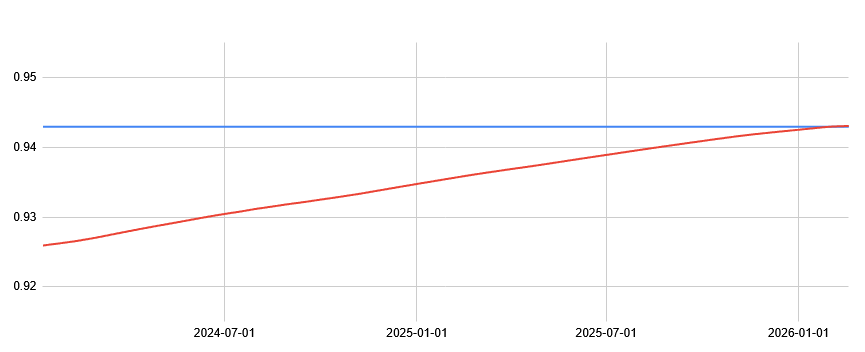
Over a short window, when you zoom in on the charts, you see the exponent oscillate around 5.65, a few hundredths above or below. You see r² move in a narrow band, sometimes crossing above or below its baseline.
This is the daily drift we expect, and measure. The structure itself isn’t a fixed number at every instant, but we observe a long-term tendency to be attracted towards this reference over time.
Here are the same charts but zoomed out.
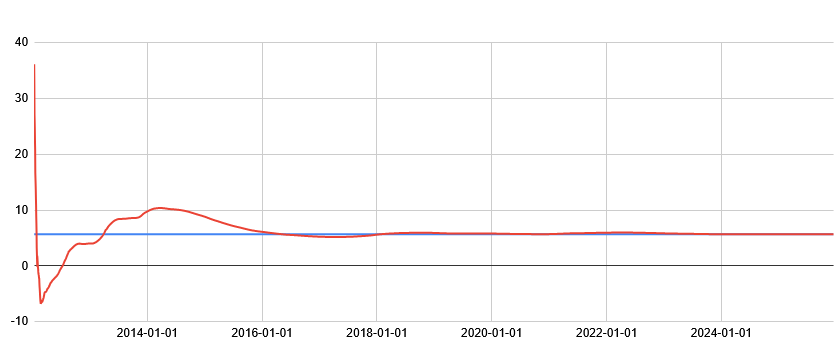
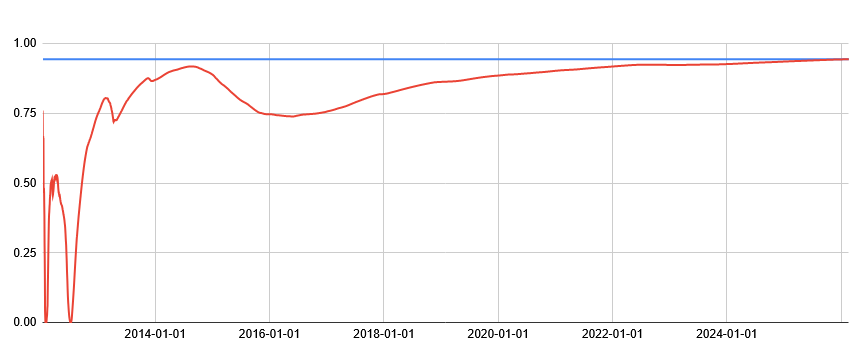
Zoom out, and those wiggles compress. The exponent and r² lines sit almost on top of their baselines. The long-term picture is remarkably straight.
Zoom out.