
Rolling Exponents Across Time Horizons
What 6Y–12Y windows reveal about the long-term attractor

We believe the exponent value 5.65 behaves as a long‑term attractor for the power law, as it describes Bitcoin’s price history with 94% accuracy. Our regular data model provides 2Y and 4Y rolling values daily. We saw an opportunity to investigate longer timeframes, 6Y through 12Y, to understand how they deviate from our long-term attractor over time.
Our hypothesis is tighter and tighter rolling exponent clustering (less sensitive than the 2Y and 4Y) as the time frame is widened.
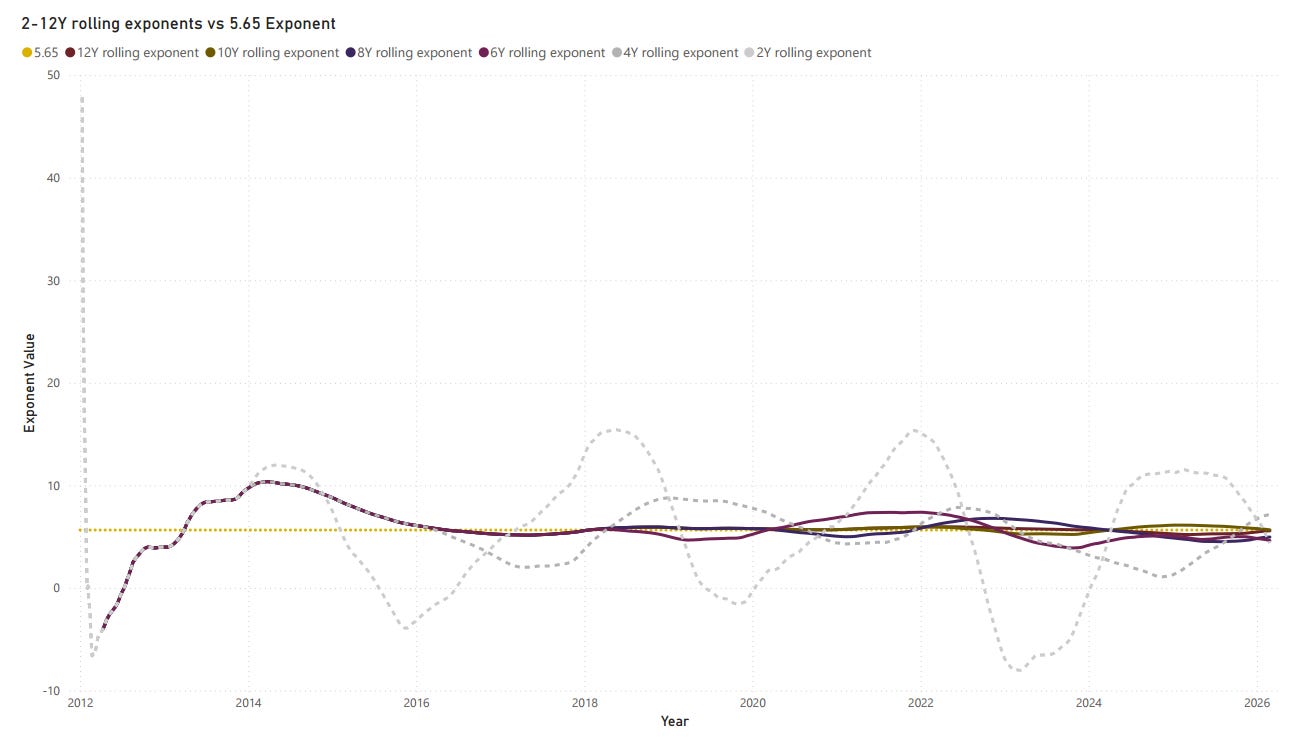
When we measure the deviation on the extremes, we observe a narrowing of ranges as the time window widens.
2Y exponent range: about -8 to 15 (the earliest data distorts this)
4Y exponent range: about 1 to 10 (the earliest data distorts this)
6Y exponent range: about 4 to 7
8Y–12Y exponents: about 4.5 to 6
As the window lengthens, the distribution tightens around and oscillates around the full model’s exponent, not far from 5.65, but drifting around slightly each day as new price data comes in.
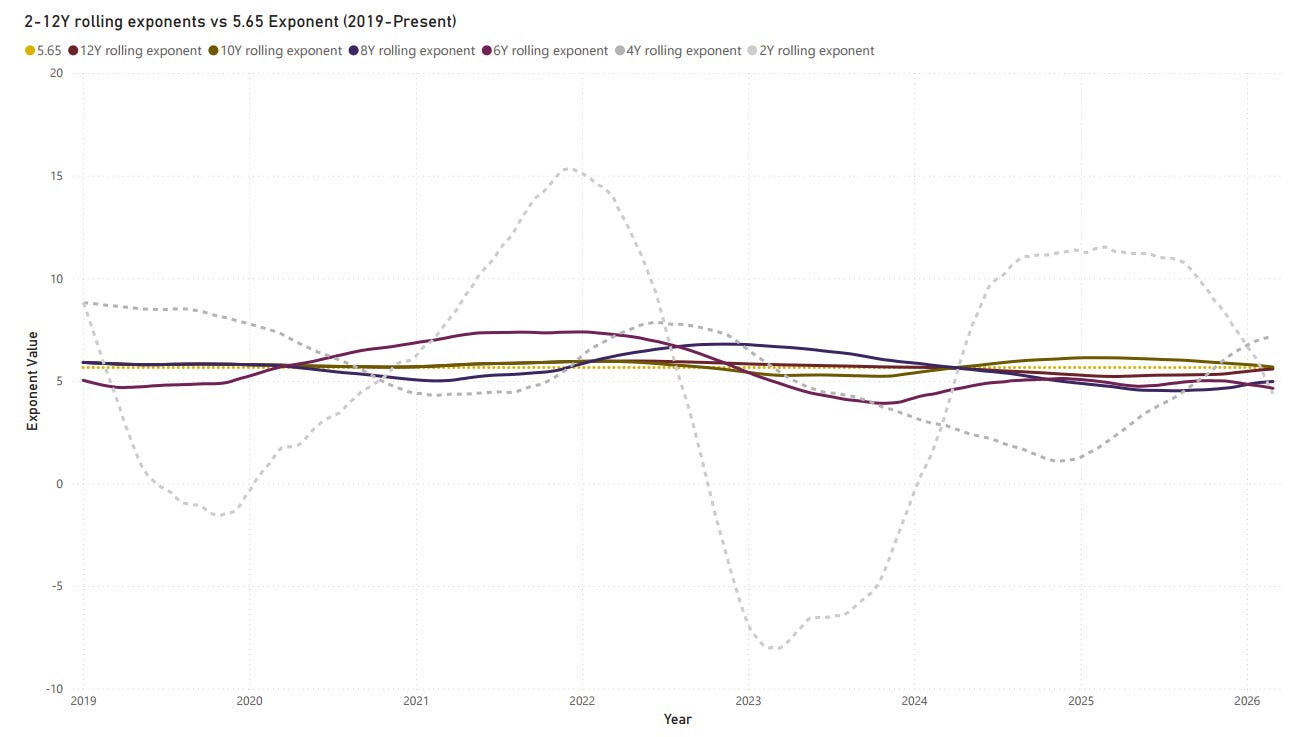
Zooming into the last 6 years, it’s clear how longer windows dampen short‑term variation. The 2Y exponent in particular is highly sensitive to recent market regimes, while 6Y and longer exponents remain within a narrower band.
This pattern suggests the underlying structural relationship (price vs time in log‑log space) is relatively stable over long horizons, and short‑term deviations reflect transitory regimes rather than a radically changing long-term structural exponent.
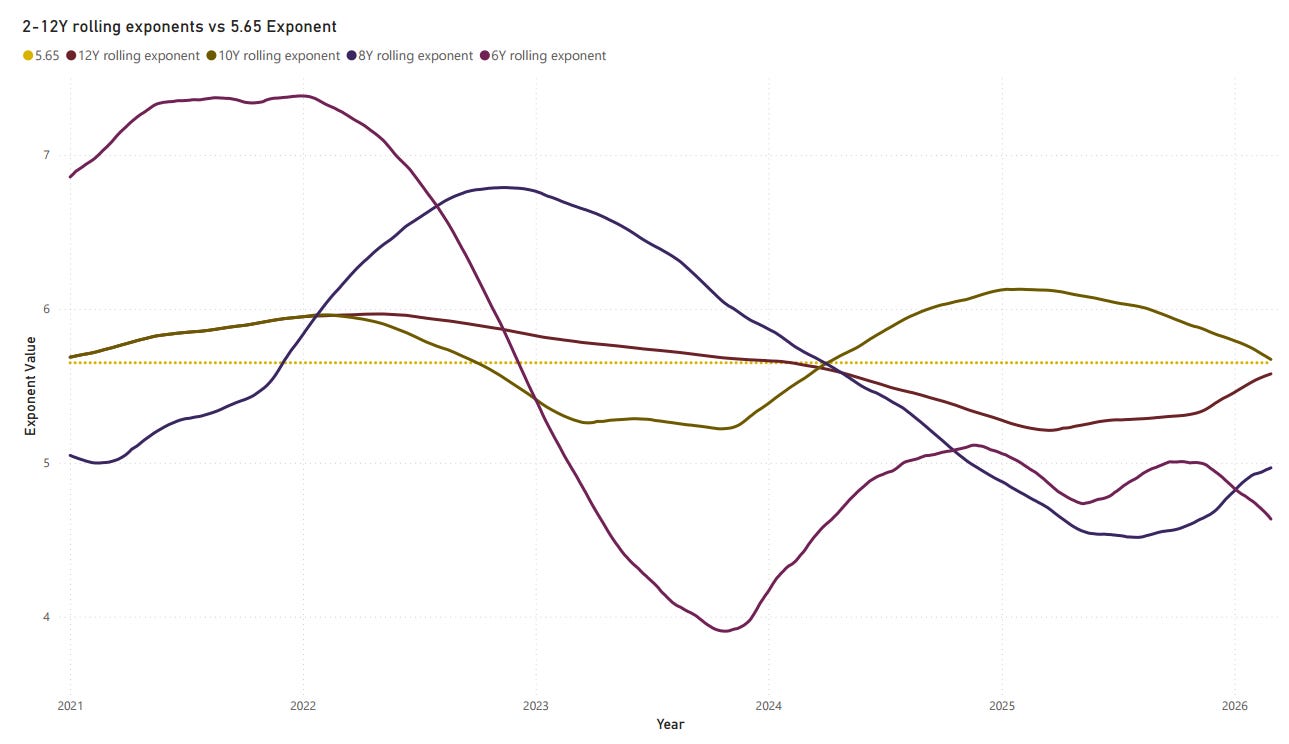
Removing the overly sensitive lines, the charts show a clear lead-lag.
Early 2022: 6Y exponent peaks around 7.3–7.4, well above 5.65, as the 2021 run‑up dominates the 6‑year window.
Late 2022 / 2023: 6Y falls and crosses below 5.65 while the 8Y (and later 10Y, 12Y) are still elevated.
2023–2024: 6Y reaches a trough near 4.0; 8Y and 10Y decline with a lag.
Late 2025–2026: 10Y and 12Y drift back toward or above 5.65; 6Y and 8Y remain lower but rising.
Shorter windows turn first, and longer windows follow with a lag. That makes shorter rolling exponents useful as potential early signals, while longer ones describe where the system tends to converge.
From about 2016 onward, when enough history exists for 6Y–12Y windows, those series oscillate in a tight band around ~5.65. They rarely move more than a few units away, implying a gravitational pull toward that exponent. This is all great news for the power law, especially when you consider the long-term model fit, r², is increasing over time.
We are seeing Structural stability. The power law exponent appears to be a structural constant over long horizons, with 5.65 acting as a practical attractor.
Different timeframes can expose noise versus signal. 2Y and 4Y exponents capture regime and cycle effects. 6Y and longer exponents better approximate the underlying growth rate. This means large deviations of short vs. long exponents (e.g., 6Y well above 5.65 while 12Y is near it) can indicate temporary overheating or stress.
We have some anchors for projections. Using 5.65 as the baseline for long‑term fair‑value projections is consistent with how longer rolling exponents behave in the data.